
Saccadometry
What is Saccadometry?
Saccadometry is an advanced oculomotor protocol that is used to diagnose central vestibular injuries including traumatic brain injury, concussion and neurodegenerative diseases. The two most common tests in the protocol are the prosaccade and antisaccade tests.
Prosaccade protocols
Prosaccade protocols are optimized to allow easy and quick collection of saccadic responses with minimum influence of subject fatigue. The eye movement measurement is automated and synchronized with stimuli presentation.
Your task is to instruct your patient to:
- Keep their head still
- Move their eyes back and forth to follow the target
- Return to the center dot each time
Calibrate the eye movement using the standard VNG calibration for VisualEyes™.
The default protocol is one center dot at the very beginning of the test which is red on a black background. A second red dot will appear randomly to the left and right at 10 degrees from the center, 60 times. If the patient fatigues, you can stop the test early.
How to instruct your patient for prosaccades
For the sake of convenience, here is a script you can follow:
“Relax, look straight ahead and do not move your head. Only move your eyes while tracking the targets on the screen in front of you. You will start by looking at the middle dot. Then another red dot will appear to the right or the left. Move your eyes to the new dot and then quickly move your eyes back to center dot. Please do your best to follow the target and move your eyes as soon as the target jumps, keeping your eyes on the dot until it moves again.”
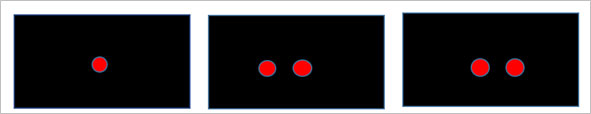
Figure 1 – The TV screen is black. A red center dot appears first, then a second center dot will appear to either the right or left side of the center dot.
Prosaccade data analysis
The software is analyzing eye position, velocity, gain, phase, and errors in the eye movements generated in response to the Saccadometry targets. Correct eye movements to the left are shown in red and correct eye movements to the right are shown in green. When there are errors present (looking in the wrong direction), the lines are dotted.
During prosaccade data collection, you will see the conventional VNG saccade graphs for latency, velocity, and accuracy.
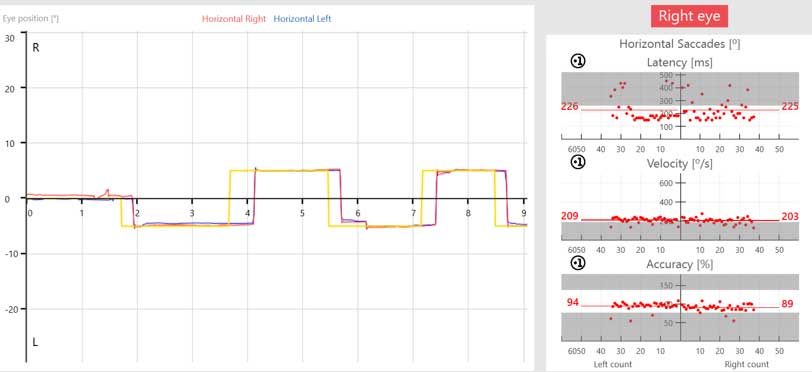
Figure 2 – Prosaccade data collection
After you have completed the test, a summary screen will appear which shows several graphical displays of the eye movements and the number of errors that were made in the protocol.

Figure 3 – Prosaccade summary screen
Antisaccade protocols
The default protocol for antisaccades is like that of the prosaccade with red dots on a black screen. The instructions to the patient are slightly different. The antisaccade involves a cognitive task where the patient must suppress the desire to look towards the new target and then decide to look away from the target.
How to instruct your patient for antisaccades
For the sake of convenience, here is a script you can follow:
“Relax, look straight ahead, and do not move your head. Only move your eyes. You will start by looking at the center dot. Then another red dot will appear to the right or the left. Move your eyes to the equal and opposite side of the new dot and then quickly back to center. Please do your best to move your eyes quickly to the position the dot would have been if it were on the opposite side.”
Antisaccade data analysis
There are no suggested threshold ranges for Saccadometry. For the antisaccades, you can see that that the eyes (red or blue tracings) are moving opposite to the dot/stimulus (yellow tracing). This is because the patient is instructed to look to the opposite side of the target.

Figure 4 – Eye movement data for the antisaccade, showing the eyes moving in the opposite direction of the saccade.
Summary graphs for prosaccades and antisaccades
The following summary graphs are available for both prosaccades and antisaccades.
1. Position
This is a distribution of the eye position over time. The Position graph tells us if the eyes accurately reach the target and how much time it took it to get there.

Figure 5 – Position graph showing small undershoots with the leftward movements. Leftward eye movements are represented by the red lines and rightward eye movements are represented by the green lines.
2. Latency
The Latency graph shows how fast the eyes initiate movement towards the target. This graph also shows where the eyes are in position relative to the 10-degree target. It shows how fast the saccades take off and land on target. The speed of initiation should be the same in both directions.

Figure 6 – Normal Latency graph
3. Phase
The Phase graph shows the speed of the eye movement at different positions along the way to reaching the target. It shows acceleration and deceleration parameters as the eye moves towards the target and then stops on the target.
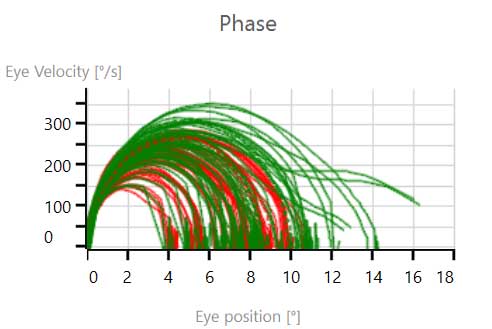
Figure 7 – Normal Phase graph
4. Velocity
The Velocity graph shows how fast the eyes move over time as they approach the target. This tells us how fast the saccades are going. It shows both acceleration and deceleration movements as the eyes move towards and then reach the target.

Figure 8 – Normal Velocity graph
5. Error rate
The directional error rate is how many times the patient looked in the wrong direction. For prosaccades, a directional error is when the patient looks away from the target. For antisaccades, a directional error is when the patient looks toward the target. The overall error rate includes artifacts in addition to the directional error rate and gives an idea of how noisy the recording may be.

Figure 9 – Normal directional error rate with a low overall error rate
6. Individual eye and target direction graphs
Implemented with VisualEyes 3.1 are graphical options that allow you to look at individual eye and target direction graphs. When you look at the individual eye plots, you can see disconjugate eye movements if they are present.
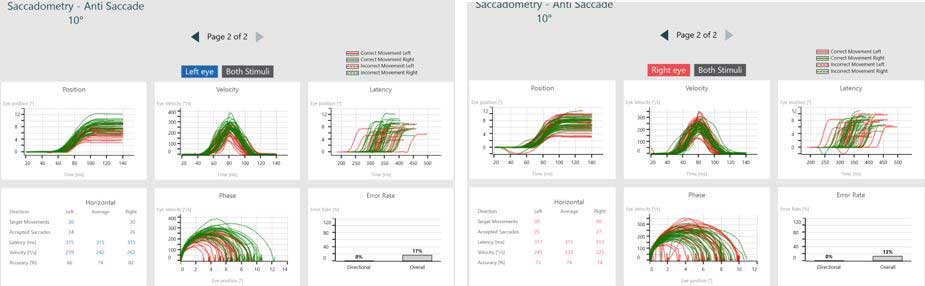
Figure 10 – Individual eye plots looking in both directions
When you look at the eye movements in each direction independently, you can quickly tell if the patient has more difficulty following the targets to one direction. Remember, leftward eye movements are represented by the red lines and rightward eye movements are represented by the green lines.
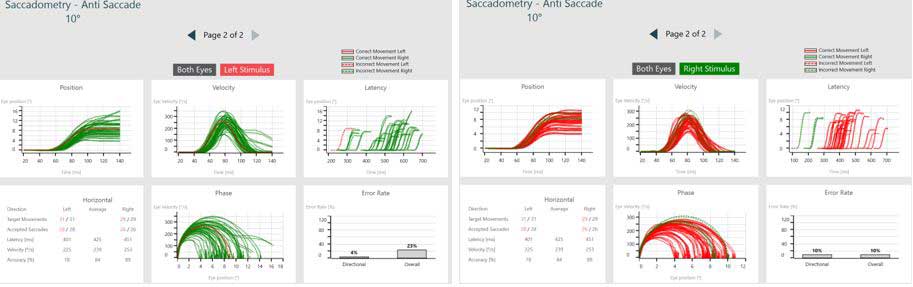
Figure 11 – Both eyes looking to each direction. Figure 11a represents all rightward eye movements (green) and Figure 11b represents all leftward eye movements (red).
7. Numerical data
Implemented with VisualEyes 3.1 are numerical data tables to aid in more detailed assessments.

Figure 12 (a) Test screen and (b) Summary screen
Adding value to the standard saccade test
In summary, the Saccadometry protocols add assessment value to the standard saccade test. As a different hemisphere of the brain controls saccades to the left or right, measuring these movements give us insights about functional asymmetries between sides of the brain and/or deficits in the precise neural generators that promote these movements. The fatigability and increased error rates further assist in the diagnosis of central abnormalities, including concussion and traumatic brain injuries.
Presenter
