
Delta Values
What is the Delta Values feature?
When fitting hearing aids to independent target curves it can sometimes be difficult to assess how far your measurement curve is away from the target curve.
Therefore, we have developed the Delta values feature which enables the Affinity Suite to calculate the difference between your measurement curve and your target curve to make your fitting appointments more efficient. This has been implemented in a manner which preserves the exisiting view you are familiar with in the REM440 module.
Preparation
- Enter your REM module as you would normally.
- Connect probe tubes to the REM reference microphones.
- Click on the Tube Calibration button
 and follow the instructions on the screen, this process ensures that the probe tube is made acoustically invisible – enabling an effective display of the actual gain achieved at the tympanic membrane by the hearing aid.
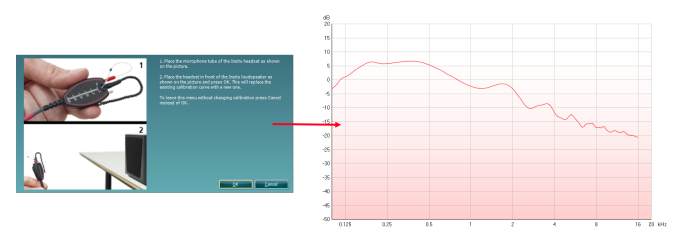
- Position the patient approximately 0.5 metres from the REM loudspeaker.
- Perform otoscopy to ensure the ear canal is clear.
- Place the REM tubes inside the patient’s ears and aim to use a marker of roughly 28mm (female) and 30mm (male) on the probe tubes. This helps to get the open end of the tube in an optimum recording position (BSA, 2018).
- Choose the protocol you would normally use in your system and apply the relevant fitting algorithm settings.
- When you get to the measurements where you are fitting hearing aids you can enable the Delta function on the left panel via the following icon.

Note: This feature can be defaulted on in your protocol settings.
Enabling this will show small values at the bottom of your graph which represent the difference between your measurement curve and the target at the standard octave frequencies. For example, when the measurement curve is below the target it will show in a negative value and when it is above it will show as positive. A correct target match would show as zero.

A target curve must exist for you to be able to use the Delta values feature and the values shown will always correspond to the selected/active curve and its target.
Note: This feature can be applied for both REIG and REAR measurements.
Note: This feature works for both in-ear measurements and coupler fitting measurements.
Note: This feature is also available when performing Visible Speech Mapping measurements.
9. Complete your fitting session as you would normally according to your protocol.
References
BSA (2018). Guidance on the verification of hearing devices using probe microphone measurements. Reading, British Society of Audiology. Available online: http://www.thebsa.org.uk/wpcontent/uploads/2018/05/REMS-2018.pdf [Accessed: 02/05/2019 10:39].
BS ISO 12124 (2001). Acoustics: Procedures for the Measurement of real-ear acoustical characteristics of hearing aids. Geneva, International Standards Organisation.