Join the Interacoustics community and receive news about new products, events and much more
Central dizziness in VNG assessments
Often when considering our options for examining central changes in VNG, the question comes of why we should look at this in the first place.
Why examine central changes in VNG?
Traditionally in videonystagmography, we have used the assessments to consider whether there is a peripheral vestibular involvement in a patient’s reported symptoms of dizziness.
Yet, the prevalence in epidemiological studies that have looked at dizziness and the presenting of dizziness within patients show that at least 25% of those putting themselves forward for specialist assessment may have some central nervous system involvement.
So, it becomes quite important to be able to examine those patients and have tools available to quantify changes that may be occurring to enable the successful identification management in treatment of those conditions.
[Note: I will be using ‘videonystagmography’ and ‘VNG’ interchangeably throughout this piece]
The limitations of brain scans
In the last three decades, we have seen brain imaging and accessibility to brain imaging becoming much more available.
Brain scans give a great deal of information when localizing cerebrally-focused pathological changes.
But from a scientific point of view, brain scans do not give us a great deal of information about the functional impact of those pathological changes.
This can be injury through trauma, through neurodegenerative disease, or some other acute lesion that is affecting the patient.
Differentiating between central and peripheral dizziness
Differentiating between central and peripheral dizziness often begins when we see dizziness in the emergency room.
A lot of recent publications such as [1] and [2] have investigated the prevalence of central dizziness, particularly in the acute setting.
Furthermore, the HINTS protocol has been widely reported for the above differentiation.
We can break the HINTS protocol down into the (video) head impulse test, nystagmus and nystagmus behavior, and test of skew.
When looking at these examinations, we can increase the sensitivity by making a much more quantifiable measurement of eye movement behavior, whether that is:
- Differentiating between peripheral, semicircular canal function and central function
- Looking at spontaneous nystagmus
- Moving between an oculomotor screening exam and vHIT
- Moving into a much more detailed oculomotor exam in VNG
Having the access to technology enables us to differentiate between these two conditions, and two presentations of dizziness much more readily.
Videonystagmography is more sensitive than MRI
Staying with eye movement examination, this is where videonystagmography is showing successive improvements.
But why the interest in eye movements when we have MRI imaging to look for central nervous system pathology?
Well, as said before, the advent of MRI has been more available over recent decades.
Although, I have also argued that functional change is not strongly represented within imaging.
Furthermore, the sensitivity of separating out some of the eye movement disorders that we can see under VNG is not always as easy to see under MRI.
Thus, we may look at isolated dysfunctions. For example, a horizontal saccade being a pons lesion, or some isolated lesions of the vertical saccade production located in the midbrain.
So, eye movements are very sensitive at giving us good access to the human physiological function covering most of the brain.
What do we need to do then to enable us to look at things in a little bit more detail?
Especially if we have already performed traditional oculomotor tests such as random saccades, smooth pursuit, and gaze holding?
Advanced oculomotor assessment
This moves us toward an advanced oculomotor assessment, using both pro- and anti-saccades to quantify eye movement behavior in relation to time, duration, and velocity.
This allows us to look at neurological changes such as central disorders, neurodegenerative diseases, right through to movement disorders, traumatic brain injury, and other neurological pathologies.
Pro-saccades
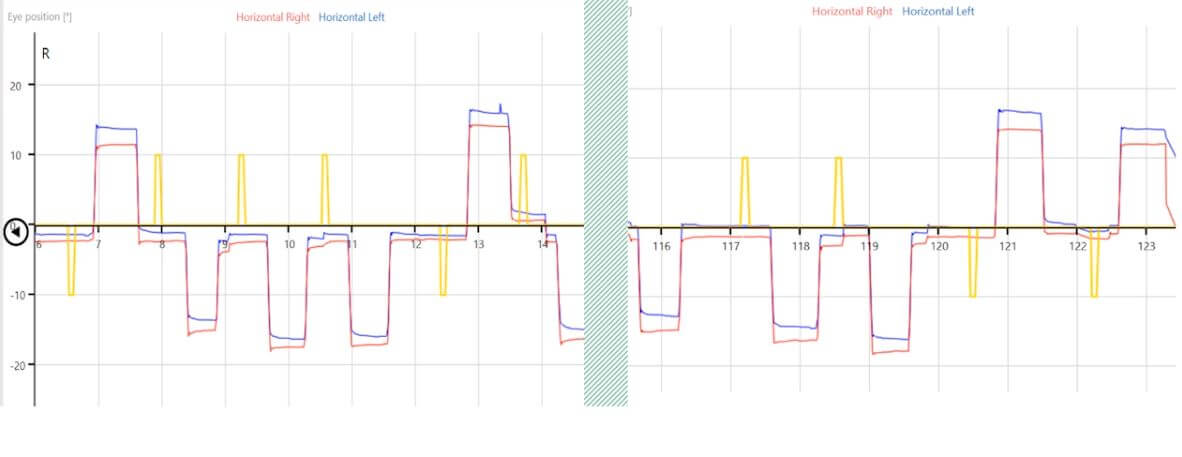
Within a pro-saccade graph, we see familiar measurements, looking at the latency, velocity, and accuracy of eye movements moving toward the target as the target changes in position (Figure 1).

Figure 1: Pro-saccade graph.
Having said that, the summary data (Figure 2) is much more detailed.
We have information in relation to:
- Eye position
- Velocity behavior of the eye right- and leftward
- Latency distributions relative to eye position in the time base
- Acceleration and deceleration of the eyes and changes in position over time
Finally, there is also the directional error rate. This becomes much more interesting when we are looking at anti-saccade behavior.

Figure 2: Pro-saccade summary data.
Anti-saccades
Anti-saccades represent a suppression of the desire to use a refixation saccade to track the target as it moves in position.
Patients are asked to move their eyes opposite to the target position. If the target moves to the right, the patient moves their eyes to the left, and vice versa.
This includes higher brain (cognitive) function to suppress those reflexes.
The analysis of the latency and latency distribution of anti-saccades gives a greater sign of the function of the frontal lobes and the frontal eye fields.
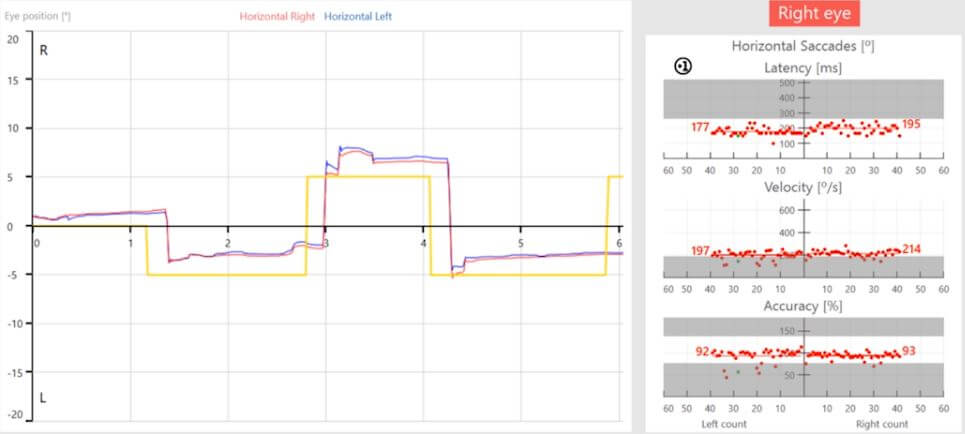
And because this has an executive brain function, directional error rates can uncover some central nervous system changes that may be not clear in any of the other subtle signs that we see in the oculomotor exam (Figure 3).

Figure 3: Anti-saccade graph.
Case study
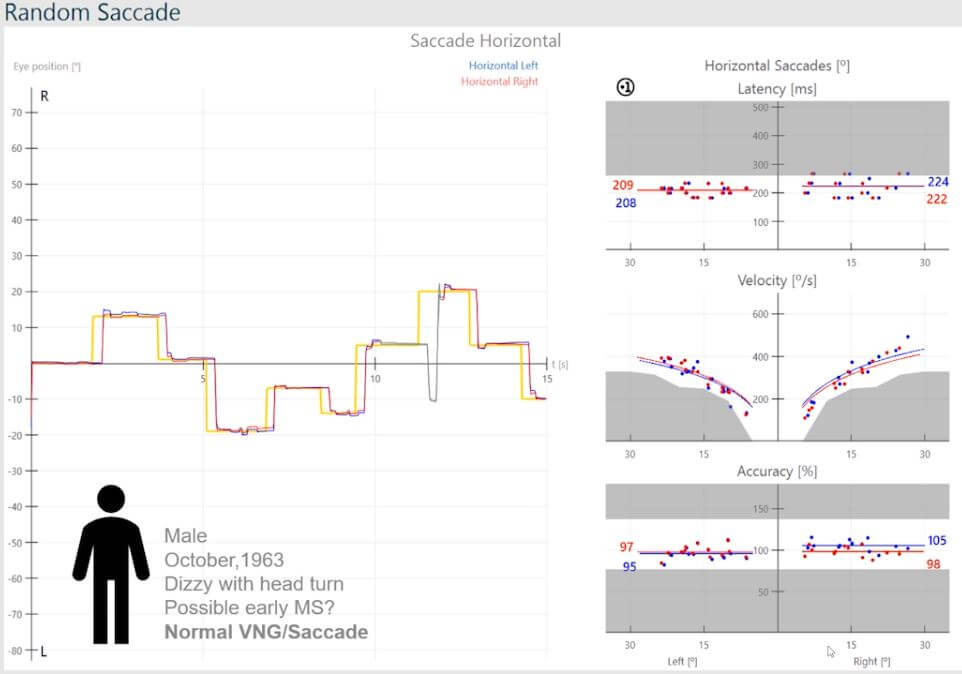
Here we have a male, born October 1963, presenting with a detailed history, but summarized with dizziness on head turns (Figure 4).

Figure 4: Normal VNG and normal saccades.
VNG has been normal and has ruled out any peripheral vestibular dysfunction, so we are not looking at any asymmetry between peripheral systems.
The thought is that this may be an early sign of multiple sclerosis.
In the presence of a normal VNG and normal saccades, one would tend to overlook any central issues.
The latency distribution’s median values are symmetric and within the normal range, and the same applies to the velocity distribution and accuracy.
The picture changes when moving into saccadometry.
Looking at the pro-saccades (Figure 5), the velocity distributions appear symmetric on face value.
But if we take a little look in a bit more detail, we can see some of those velocity values are falling into the abnormal range.
And if we look at the accuracy, whilst the median values are symmetric, we can see inaccurate saccades with leftward movements.

Figure 5: Pro-saccade graph with abnormal velocity values and inaccurate saccades with leftward movements.
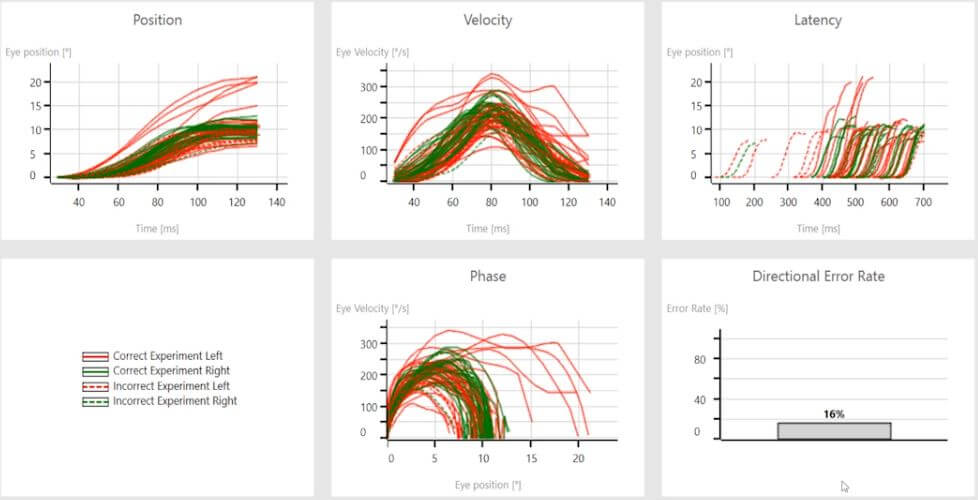
When we move this examination into the anti-saccades (Figure 6), we can see delayed latency distributions that are equal between right- and leftward movements.
This is also visible in the phase.
The rightward movements representing the left hemisphere are tightly bundled, while the leftward movements representing the right hemisphere show poor correlation of eye velocity in different positions.
This is often referred to as a spaghetti-like appearance.
Also, the directional error rate is greater than 7%, which is a red flag for central nervous system changes.

Figure 6: Anti-saccade summary data with delayed latency, spaghetti-like phase for the right hemisphere, and a directional error rate of 16%.
Key takeaway: In this case, the application of saccadometry gave a greater insight into the abnormal brain function that was not uncovered in the routine screening through random saccades.
References
[1] Newman-Toker DE, Kerber KA, Hsieh YH, Pula JH, Omron R, Saber Tehrani AS, Mantokoudis G, Hanley DF, Zee DS, Kattah JC. HINTS outperforms ABCD2 to screen for stroke in acute continuous vertigo and dizziness. Acad Emerg Med. 2013 Oct;20(10):986-96. doi: 10.1111/acem.12223. PMID: 24127701.
[2] Lee AT. Diagnosing the cause of vertigo: a practical approach. Hong Kong Med J. 2012 Aug;18(4):327-32. PMID: 22865178.

Similar Topic
Stay up to date!
Subscribe to our newsletter and receive news on new products, seminars and much more.
By signing up, I accept to receive newsletter e-mails from Interacoustics. I can withdraw my consent at any time by using the ‘unsubscribe’-function included in each e-mail.
Click here and read our privacy notice, if you want to know more about how we treat and protect your personal data.
