Distortion Product Otoacoustic Emissions (DPOAEs): A Complete Guide

This guide provides clinicians with a complete introduction to distortion product otoacoustic emission testing to support protocol selection, measurement, troubleshooting, and interpretation of DPOAE results.
Table of contents
- What are DPOAEs?
- How distortion products are generated
- Clinical applications and choosing DPOAEs
- Equipment and patient preparation
- Selecting a DPOAE protocol
- Performing a DPOAE measurement
- Pressurized DPOAEs
- Analysis and interpretation
- Normative data and pediatric research
- Troubleshooting
- Frequently asked questions
What are distortion product otoacoustic emissions (DPOAEs)?
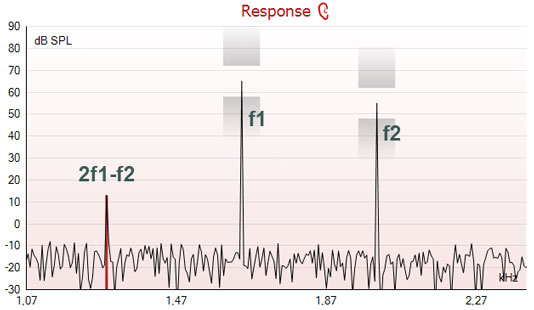
Distortion product otoacoustic emissions are low-level sounds produced by the cochlea’s outer hair cells when two pure tones are presented at the same time. These primary tones are called f1 and f2. The clinically used distortion product is most measured at 2f1-f2, while the clinical test point is conventionally labelled by f2.
DPOAEs provide objective, ear-specific information about outer hair cell function. They do not directly assess inner-hair-cell or acoustic-nerve function, and they do not directly measure behavioral hearing thresholds. You should therefore interpret results within the wider audiological test battery.
Why do outer hair cells matter?
Outer hair cells act as small cochlear motors. Their activity contributes to hearing sensitivity and clear frequency discrimination. DPOAEs provide a direct way to assess this outer hair cell mechanism, while other tests are needed to examine the remaining parts of the auditory pathway.
How distortion products are generated
A pure tone is represented by a single frequency line in the frequency domain. When that tone is distorted, some energy is redistributed to more frequencies. The size and pattern of these new frequencies depend on the nature of the distortion and the level of the original signal.
Why two primary tones are used
A single-tone harmonic could arise from either the cochlea or distortion within the probe loudspeaker. Presenting two tones through separate transducers creates intermodulation products that require both tones to be present.
As the cochlea is the part of the signal path where both tones combine, an intermodulation product recorded in the ear canal can be linked to cochlear activity.
The family of distortion products
The interaction of f1 and f2 generates a family of products, including the difference tone f2-f1, lower sidebands such as 2f1-f2 and 3f1-2f2, and upper sidebands such as 2f2-f1. Upper sidebands are not commonly used clinically.
The first lower sideband, 2f1-f2, is usually the largest and most clinically robust product and is the response generally referred to as the DP.
The DP-gram
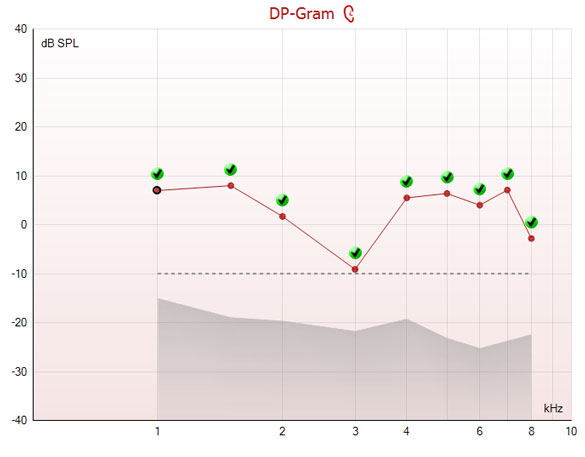
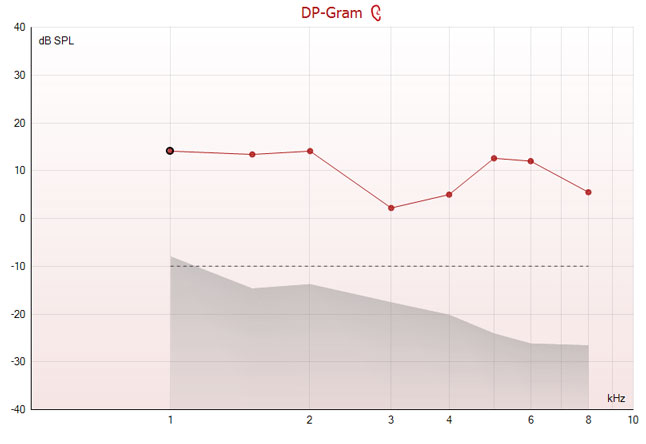
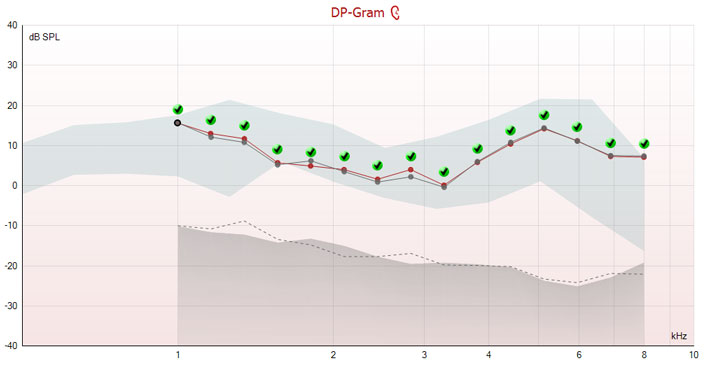
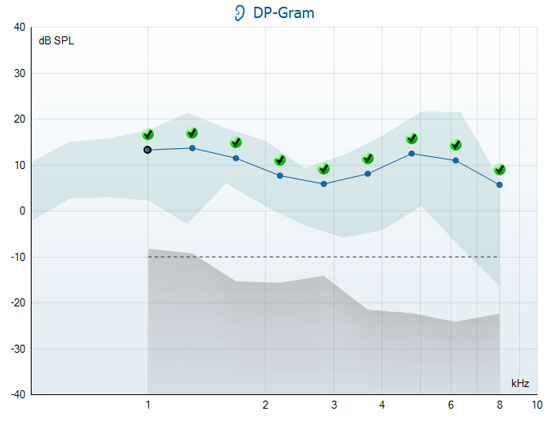
A DP-gram displays DP level and estimated residual noise at each f2 test frequency (Figure 2). Although its appearance resembles an audiogram, DP level cannot be used to reliably estimate an individual hearing threshold.
The response depends on outer hair cell energy input and the non-linear distortion used to make the emission measurable, neither of which has a sufficiently direct relationship with behavioral thresholds.
For example, a 12 dB DP level at 1 kHz could be associated with a behavioral threshold ranging from approximately -5 to 35 dB. Thus, DPOAE results should not be used on their own to prescribe amplification or estimate an exact threshold.
Clinical applications and choosing DPOAEs
Before diving into which type of DPOAEs you should measure – and whether you should go with TEOAEs instead – Table 1 lists some of the main clinical applications of DPOAEs.
| Application | Purpose |
| Cross-checking | Validate results from pure tone audiometry, play audiometry, or visual reinforcement audiometry. |
| Provide ear-specific cochlear information | Valuable when behavioral testing is incomplete or unavailable. |
| Assessment | In infants, children, and adults within a wider diagnostic test battery. |
| Baseline establishment | For ototoxicity monitoring or other longitudinal monitoring. |
| Detecting change over time | Change may sometimes appear in OAEs before it is evident in audiometry. |
Table 1: Clinical applications of DPOAEs.
Screening and diagnostic DPOAEs
Screening protocols usually return PASS or REFER and may not display all analytical parameters.
A REFER result indicates that the selected response criteria were not met during that measurement and further assessment may be needed. Reduced or absent responses may reflect cochlear dysfunction, outer or middle ear conditions, noise or test technique.
Diagnostic protocols should cover the clinically relevant frequencies, collect sufficient data, and display DP level, noise, and other quality measures for interpretation.
DPOAE or TEOAE?
Both methods generally perform well from approximately 1.5 to 4 kHz and have limitations at 500 Hz and below. DPOAEs generally perform better above 4 kHz, while TEOAEs generally perform better between approximately 500 Hz and 1.5 kHz.
DPOAEs measure frequencies sequentially and may take longer, although they can provide more detailed frequency information and may be less affected by some forms of noise. A quiet environment remains preferable for both methods.
Age and patient-state considerations
Older children and adults can usually follow instructions to remain still and quiet, whereas it’s a good idea to test infants while they are asleep to make it easier to get a quiet recording. Thus, testing when the infant is tired – and fed beforehand – may help encourage sleep.
Toddlers may enjoy calm distractions, such as a favorite program, a book, bubbles, or sensory toys. Where possible, avoid activities that increase movement or vocalization. A handheld wireless system can be taken to the child, allowing testing on a parent’s lap, in a chair, or in a pram.
Equipment and patient preparation
Please observe the steps below before selecting a DPOAE protocol and performing the measurement.
Pre-test checks
- Perform otoscopy to check for contraindications or obstructions and to assess the size, shape, and angle of the ear canal.
- Select an appropriately sized probe tip, as a tip that is too large or too small may cause leakage and reduce recording quality.
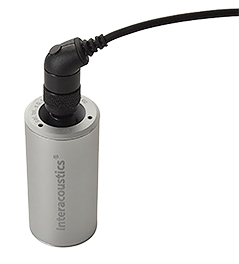
- Inspect and clean the probe, then complete the clinic’s cavity or integrity check using a representative DPOAE protocol (Figure 3).
- Consider tympanometry results because OAEs depend on both forward and reverse middle ear transmission.
Patient instruction and cable management
Explain that the test is brief, sounds will be presented, and the patient does not need to respond. Ask the patient to remain as still and quiet as possible. Aim to minimize movement of the handheld device.
If the probe is cabled, avoid touching the cable and secure it to clothing so the patient does not need to hold it.
Probe check
An appropriate probe fit is usually shown by a relatively flat response across a wide frequency area. Before starting, check for leakage and confirm that the primary-tone levels and stimulus amplitude are stable and appropriate.
Selecting a DPOAE protocol
Below, we’ll consider steps involved in selecting a DPOAE protocol.
Frequencies, levels, and ratio
Choose the f2 frequency range and point density required by the clinical question. A diagnostic protocol may cover approximately 1 to 6 kHz, with higher or intermediate points used when more detailed information is needed. A 65/55 dB SPL L1/L2 relationship and a f2/f1 ratio close to 1.22 are common in clinical settings.
Know what the protocol will do
Bear the following in mind for testing:
- Check the maximum time or sweep count for each point or for the full test.
- Confirm how many frequencies will be measured and which frequencies they are.
- Check whether testing can stop when the required number of frequencies and SNR criteria have been met, rather than continuing until all available sweeps are collected.
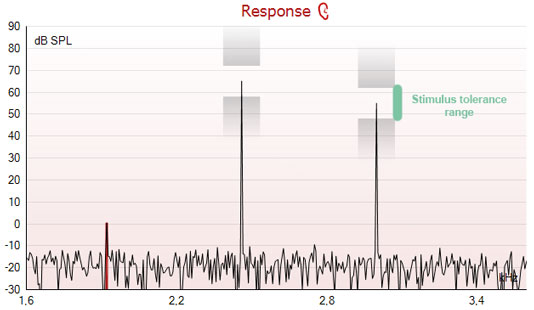
- Use stimulus tolerance settings to confirm that f1 and f2 remain close to their intended levels (Figure 4).
Weighted averaging
OAEs are small relative to noise, so sufficient data need to be averaged. If noise is constant, doubling the test duration improves SNR by approximately 3 dB. Weighted averaging is designed for non-stationary noise and gives greater weight to higher-quality data, which may reduce test time when noise varies during the measurement.
How to perform a DPOAE measurement
- Complete otoscopy, select the probe tip, and provide clear patient instructions.
- Insert the probe securely and aim to minimize movement of the device, probe, and cable.
- Inspect the probe check, leakage, and primary-tone levels.
- Start the test with the device, shoulder box, or software, as applicable.
- Monitor stimulus stability, noise, and progress at each frequency.
- Stop the measurement manually once you have collected sufficient, valid information or allow the defined stopping criteria to end the test.
- After testing, remove the probe and repeat otoscopy if clinically indicated.
Pressurized DPOAEs
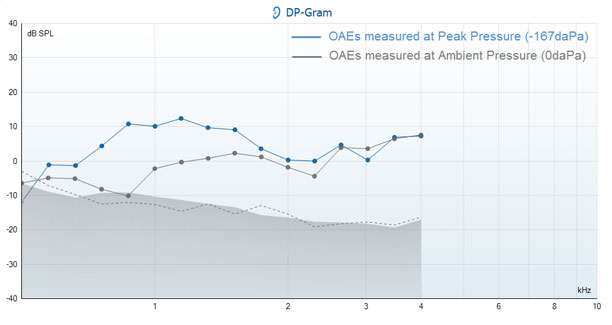
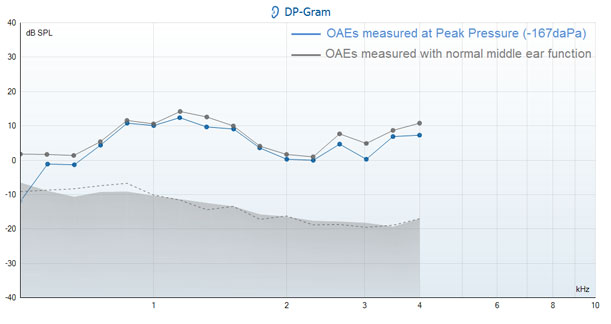
OAE recording depends on forward transmission of the primary tones and reverse transmission of the emission through the middle ear. Negative middle ear pressure commonly reduces low frequency transmission and may affect the OAE more than the behavioral threshold suggests.
Recording at tympanometric peak pressure may help compensate for this effect and allow you to evaluate outer hair cell function more directly (Figures 5-6).
Analysis and interpretation
Before interpreting the result, first review measurement validity. Consider probe fit, stimulus stability, residual noise, and whether you collected sufficient data before deciding whether a DP is present.
DP level, residual noise and SNR
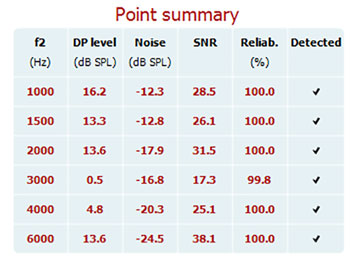
DP level describes the emission amplitude. Residual noise reflects patient and environmental noise after the amount of averaging achieved. SNR combines these two factors, so it should be considered alongside both the absolute DP level and the final noise floor.
If residual noise is high and little DP response is visible, consider repeating the measurement after reviewing the test environment, patient state, probe fit, noise rejection, and averaging method.
How noise is estimated
Real noise occupies a range of frequencies. Many OAE systems therefore estimate the noise at the DP frequency from an ensemble of adjacent frequency points rather than relying on a single narrow point. Manufacturers may differ in how many adjacent points are included.
Reliability and repeatability
Because DPOAEs use continuous stimuli, a measured frequency could theoretically coincide with noise. Reliability, response stability, and repeat measurement can help establish that the DP represents a genuine response.
If advanced measures are unavailable, obtaining similar DP levels on a repeated measurement provides useful, extra verification.
Practical noise-floor expectations
A typical adult noise floor may be approximately -20 dB SPL at 2 kHz and above; for infants and children a target of -10 dB SPL or lower can be used.
Low-frequency noise is often greater because of respiration. Otitis media or other middle ear dysfunction may also raise the noise floor and limit interpretation.
Adding intermediate points
After a measurement has stopped, intermediate frequency points can be added and testing continued so that the extra points are incorporated into the stored DP-gram. This may help provide a closer examination of an unexpected frequency region.
A DP-gram is not an objective audiogram
DP level cannot be used to reliably predict an individual hearing threshold. DPOAEs provide information about outer hair cell function and are commonly absent when hearing loss exceeds approximately 40 dB.
However, population-level correlations do not allow accurate threshold estimation for an individual patient.
Test-battery interpretation
Compare monitoring measurements with the baseline and consider tympanometry results. Hearing loss at one frequency may reduce DPOAEs across a wider range, so the result may be less frequency-specific than the DP-gram suggests.
OAEs do not directly assess inner hair cell function or neural synchrony. Patients with auditory neuropathy spectrum disorder may have recordable OAEs while functional hearing ranges from normal to profound.
Normative data and pediatric research
Children younger than two years typically have average OAE levels approximately 15 dB higher than adults. This may be partly related to relatively pristine cochlear function and partly to differences in middle ear transfer. You should therefore use age-appropriate reference values for infants.
Normative data should be appropriately matched to the patient’s age, test frequencies, primary levels, ratio, equipment, and response calculation. Standardized, age-appropriate criteria can support diagnostic decisions and communication with families.
Read more: Distortion Product Otoacoustic Emissions (DPOAE) Interpretation Protocol for Infants and Children
DPOAE troubleshooting
Table 2 lists common issues and how to troubleshoot them.
| Issue | How to troubleshoot |
| High residual noise | Where possible, improve the test environment, help the patient settle, secure the cable, adjust the probe fit, or extend averaging. |
| Primary levels outside tolerance | Stop the measurement, refit the probe, and consider repeating the test. |
| Acceptable SNR with a low DP level | Consider recording quality separately from cochlear response level and compare the result with appropriate normative data. |
| Unexpected, isolated point | Review reliability and noise and consider adding intermediate points or repeating the measurement. |
| Reduced low-frequency responses with negative pressure | Assess middle-ear function and consider pressurized DPOAEs where available. |
| Apparent change over time | Check that the equipment, protocol, probe fit, middle-ear status, and noise conditions are comparable before interpreting the finding as a biological change. |
Table 2: Common DPOAE troubleshooting.
Frequently asked questions
Find answers to frequently asked DPOAE questions below.
Why are two tones used?
Two tones generate intermodulation products that require both tones to be present. Presenting them through separate transducers helps distinguish cochlear distortion from distortion generated by either transducer alone.
Why is 2f1-f2 normally measured?
2f1-f2 is the first lower sideband. This is usually the largest intermodulation product and has proved the most clinically robust.
Does a 6-dB SNR prove that the response is normal?
No. SNR helps establish whether the DP can be distinguished from noise. Normality also depends on absolute DP level, measurement quality, and appropriately matched normative data.
Can a DP-gram estimate hearing thresholds?
No. DP level is not sufficiently correlated with behavioral threshold to estimate an individual hearing threshold or determine hearing aid fitting settings.
Why are age-specific norms important?
Infants and young children typically have larger OAE amplitudes than adults, and their middle ear transfer characteristics differ. Reference data should therefore be appropriately matched to the patient population and protocol.
When are DPOAEs particularly useful?
They are useful when detailed frequency information is required, including diagnostic cross-checking and ototoxicity or longitudinal monitoring.
Related Interacoustics Academy resources
- Course: Approaches to Newborn Hearing Screening
- Article: Otoacoustic Emissions (OAEs): A Complete Guide
- Course: Mastering Distortion Product Otoacoustic Emissions (DPOAEs)
- Course: Mastering Transient Evoked Otoacoustic Emissions (TEOAEs)
References and further reading
Beck, D. L., Speidel, D., Arrue Ramos, J., & Schmuck, C. (2016). Otoacoustic emissions and pressurized OAEs. Hearing Review, 23(7), 30.
Blankenship, C. M., Hunter, L. L., Keefe, D. H., Feeney, M. P., Brown, D. K., McCune, A., Fitzpatrick, D. F., & Lin, L. (2018). Optimizing clinical interpretation of distortion product otoacoustic emissions in infants. Ear and Hearing, 39(6), 1075–1090.
Dhar, S., & Hall, J. W., III. (2018). Otoacoustic emissions: Principles, procedures, and protocols.
Glattke, T. J., & Kujawa, S. G. (1991). Otoacoustic emissions. American Journal of Audiology, 1(1), 29–40.
Hunter, L. L., Blankenship, C. M., Keefe, D. H., Feeney, M. P., Brown, D. K., McCune, A., Fitzpatrick, D. F., & Lin, L. (2018). Longitudinal development of distortion product otoacoustic emissions in infants with normal hearing. Ear and Hearing, 39(5), 863–873.
Kemp, D. T. (2002). Otoacoustic emissions, their origin in cochlear function, and use. British Medical Bulletin, 63(1), 223–241.
Manley, G. A., Fay, R. R., & Popper, A. N. (Eds.). (2008). Active processes and otoacoustic emissions in hearing.
McCreery, R. (2013). Building blocks: Otoacoustic emissions: Beyond ‘pass’ and ‘refer.’ The Hearing Journal, 66(9), 14–16.
Ramos, J. A., Kristensen, S. G. B., & Beck, D. L. (2013). An overview of OAEs and normative data for DPOAEs. Hearing Review, 20(11), 30–33.
Robinette, M. S., & Glattke, T. J. (Eds.). (2007). Otoacoustic emissions: Clinical applications.
Presenter
Amanda Goodhew
Amanda holds a Master's degree in Audiology from the University of Southampton. She has extensive experience holding senior audiologist positions in numerous NHS hospitals and clinics, where her primary focus has been pediatric audiology. Her specific areas of interest include electrophysiology (in particular ABR, ASSR and cortical testing), neonatal diagnostics and amplification and the assessment and rehabilitation of patients with autism and complex needs. Amanda has a particular interest in pediatric behavioral assessment and has twice held the Chairperson position for the South London Visual Reinforcement Audiometry Peer Review Group. Amanda also works as an independent technical assessor for the United Kingdom Accreditation Service, undertaking quality assessment for audiological services throughout the UK, and provides guest lecturing services to universities both in the UK and abroad.