
Tympanometry: An Introduction
Description
Table of contents
- What is tympanometry?
- What is a tympanometer?
- Test procedure
- Interpreting the results
- Calibration for tympanometry
What is tympanometry?
Tympanometry is a method of testing the function of the middle ear. Unlike audiometry, it does not test the ear’s sensitivity to sound or the hearing threshold of the patient. Instead, it is used to detect if sound, when presented to the ear canal, travels through the middle ear space effectively.
This information is used clinically to determine if the middle ear space is functioning correctly or if there is a condition affecting the transfer of sound through the middle ear to the cochlea. Conditions such as middle ear effusions and eustachian tube dysfunction are common pathologies which you can detect with tympanometry.
What is a tympanometer?
The equipment used to perform tympanometry is called a tympanometer. There are a variety of styles and types of tympanometers, but at their most basic form they have five common elements:
- A visual display or interface to show results.
- A pump which regulates the pressure in the ear canal.
- A microphone that records the sound pressure level in the ear canal.
- A speaker which produces the necessary probe tones to run the measurement.
- A probe with a rubber probe tip which forms a seal in the ear canal and contains outlets for the other components.
Table 1 outlines the available tympanometers from Interacoustics.
| Tympanometer | Type |
| AA222 | Desktop tympanometer and audiometer |
| AT235 | Desktop tympanometer and audiometer |
| MT10 | Handheld screening tympanometer |
| Titan | Handheld screening, diagnostic or clinical tympanometer |
Table 1: Tympanometers from Interacoustics.
How does a tympanometer work?
A tympanometer will use the probe and probe tip to form a seal in the ear canal and produce a probe tone (Figure 1).
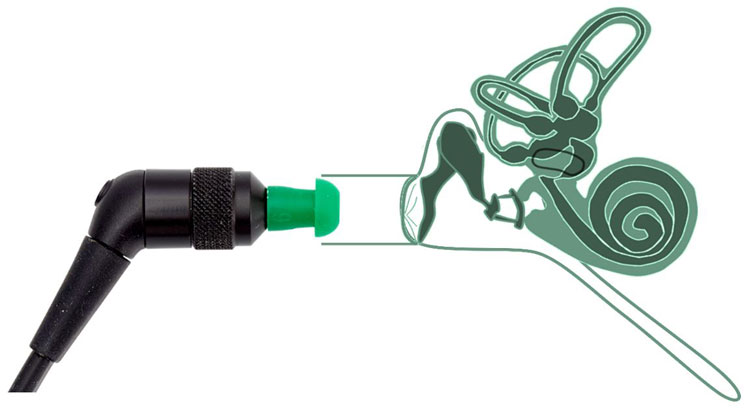
Traditionally, a 226 Hz probe tone is used in adults and 1000 Hz is used in infants. More commonly these days is to use a wideband stimulus such as a wideband click in both adults and children to run the measurement.
After a probe tone is introduced to the ear, the admittance (ease of energy flow) is then recorded. At the same time, the pump will change the pressure in the ear canal to assess how the admittance is affected under different pressure conditions.
To measure the admittance, a microphone is placed in the ear canal alongside the probe and pump. Using this microphone, the tympanometer maintains a consistent sound pressure level in the ear canal using an automatic gain control circuit (AGC).
The admittance is derived from the electrical current needed to maintain the sound level throughout the measurement. The concept here is that under different pressure conditions, varying energy levels will pass into the middle ear.
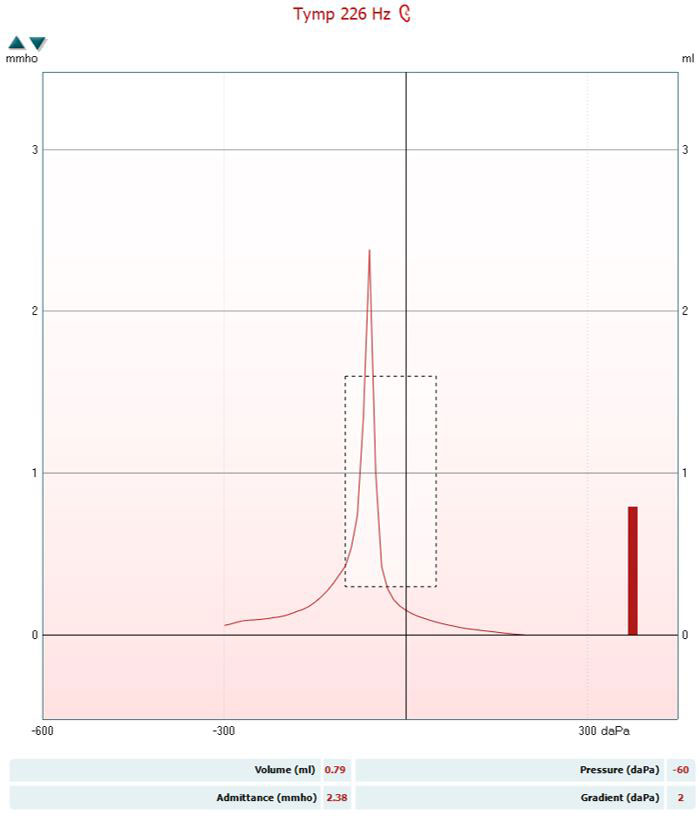
These data points are then plotted on a graph called a tympanogram which displays admittance measured in mmho as a function of middle ear pressure measured in daPa (Figure 2).
Setting up a measurement
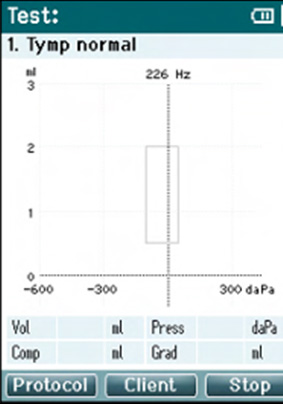
Figure 3 shows some of the parameters available with the Titan tympanometer.
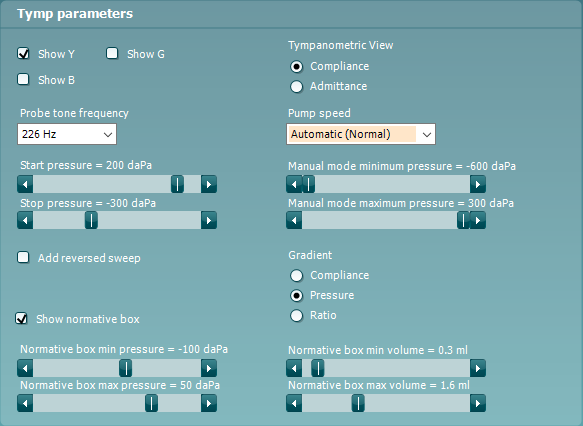
Here you will see some of the parameters which you can change when performing the test. Typically, devices are configured with pre-set protocols optimized for recording the best quality measurements and you will not need to make changes to these settings.
Should you wish to learn about some of these parameters in detail, read on below. Otherwise, you can skip to the test procedure.
Probe tone frequency
As mentioned, you can use several different stimuli to generate the probe tone. For patients older than 6 months, 226 Hz is commonly used. This frequency is used partially for historic reasons.
The first commercially available tympanometers used a probe tone frequency of 220 Hz as microphone technology at the time was most sensitive at this frequency. It was subsequently found that 226 Hz was a better choice as it could be used to measure the ear canal volume more accurately than 220 Hz. This then became the standard for testing adults.
With the advent of newborn hearing screening, it was found a different stimulus was needed for infants less than 6 months of age. This is because newborns and young infants have flaccid ear canal walls, which can cause false-negative results when using 226 Hz.
Studies using higher probe tone frequencies such as 1000 Hz have demonstrated that, at these frequencies, the flaccid ear canal walls in infants have a much smaller effect on the admittance. Therefore, 1000 Hz is the preferred probe tone frequency for newborns.
More recent research has revealed that wideband stimuli provide more information than single frequency probe tones and the same stimulus can be used across different age ranges. Therefore, we are seeing a shift toward clinicians performing wideband tympanometry as the gold standard tympanometry measurement.
Air pump method and speed
You can operate the air pump in a tympanometer manually or automatically. The most common method of performing tympanometry is to select an automatic pump.
When you control the pump automatically, you can still choose between different pump speeds. Generally, the faster the pump speed, the more robust the recording is to noise (e.g. a crying child, chewing or swallowing). However, this speed comes at a price as you collect less data points.
Slower pump speeds allow you to collect more information during the measurement and are therefore considered more accurate. This means it is important to assess which pump speed will be best for each patient before starting the measurement.
When controlling the pump manually, the clinician can increase and decrease the air pressure in the ear canal to their preferences. This can be useful to ensure the procedure is comfortable for someone that is sensitive or experiencing discomfort. This also allows the flexibility for more advanced testing of the middle ear which is beyond the scope of this article.
Pressure range
Most tympanometers will have a range of pressures which the pump can adjust to. Typically, this is in the pressure range from minus 600 daPa to 300 daPa. It is not necessary to test to the extremes of this range.
The highest pressure will be used to measure the equivalent ear canal volume and should be between 200 to 300 daPa.
The minimum pressure should be at least minus 300 daPa. This is because certain middle ear conditions can cause the peak of the tympanogram to shift negatively. If the pressure range is to narrow, this will not be recorded.
Compliance or admittance
Lastly, when performing tympanometry using a 226 Hz stimulus, you can select to view the results in admittance or compliance. Admittance is measured in mmho, and compliance is measured in ml. Throughout this article, we have used the term admittance to describe the flow of energy across the middle ear but some references in tympanometry will show compliance. This is because compliance and admittance have a 1:1 relationship at 226 Hz. Historically, many in the audiological community also felt that the term compliance was easier to understand over admittance.
However, given that this relationship does not exist at other probe tone frequencies, we find it easier to use the term admittance.
Test procedure
Before beginning a tympanometry measurement, it is important to look for any contraindications.
Contraindications to tympanometry
Occluding wax or active infections/discharge will contraindicate tympanometry as the results are likely to be affected by the condition of the ear canal and will not give a true reflection of the condition or function of the middle ear.
You may also find a patent condition such as a perforation in the ear drum, which makes the test less useful to perform.
If the patient is experiencing pain in the outer ear, then the placement of the probe could be intolerable. If, on observing the ear drum, the pain seems to be originating from the middle ear, then the act of pressurization during tympanometry may also be intolerable.
It should be noted that more advanced systems can perform non-pressurized middle ear measurements, which allows you to perform tympanometry in the contraindicated cases above.
With any contraindications handled or mitigated by your equipment, you can then move on to step 1 in the test procedure.
Step 1: Otoscopy
The first step in tympanometry is to perform otoscopy to check the condition of the ear canal and ear drum, and to also to check for any occluding wax and any other contraindications mentioned earlier.
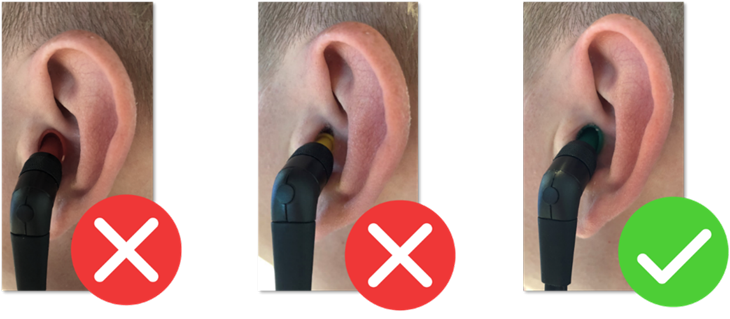
Step 2: Probe tip selection
The next step is to select a probe tip. The tip should be single-use silicone or rubber and the size selected should be large enough to form a tight seal in the ear canal, without being so large that it pushes itself loose during the measurement. See Figure 4 for examples.
Step 3: Start the measurement
When the seal is obtained, the measurement begins.
The ear canal pressure starts at atmospheric pressure. The pump will typically increase the ear canal air pressure to maximum, normally between 200 to 300 daPa. At this point, you can measure the equivalent ear canal volume.
Once this has been recorded, the pressure should steadily reduce to the minimum pressure determined in the equipment protocol. Throughout the entire measurement, the admittance (or compliance at 226 Hz) of the ear is recorded.
Step 4: Remove probe
After you have measured the admittance at the minimum ear canal pressure, then you should return the air pressure to 0 daPa before removing the probe.
This happens automatically when running an automatic pump measurement. If you are running a manual measurement, you will need to complete this step manually.
This is essential as you can damage the ear drum if you remove the probe while the ear canal is pressurized.
Step 5: Repeat otoscopy
After you have removed the probe, then you should perform otoscopy again to ensure there has been no damage to the ear canal or ear drum.
Interpreting the results
After you have completed the test procedure, you can then move on to interpreting the results.
Reading the tympanogram
The tympanogram is normally displayed as a graph along with extracted numerical data displayed in a table below the measurement. Below you can see a tympanogram which was measured using a 226 Hz probe tone in the right and left ears (Figure 5).
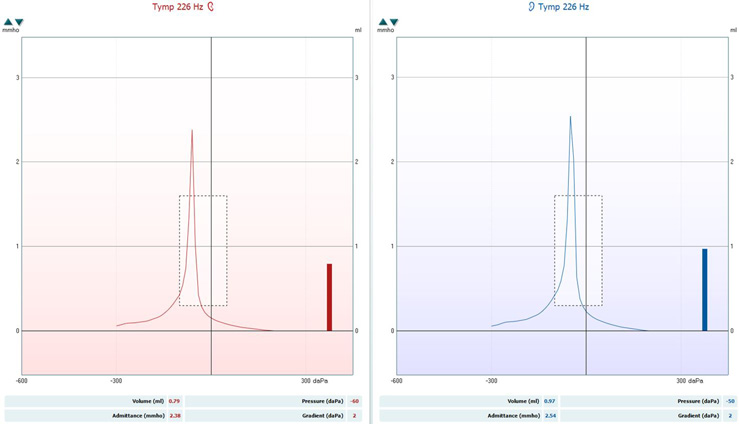
Red represents the right ear and blue the left. Let’s look at the key pieces of information to extract from these graphs.
Peak pressure
This is the ear canal pressure at which peak (maximum) compliance is recorded. In healthy ears, this peak should be recorded between -50 to 50 daPa for adults, and minus 100 daPa to 50 daPa for children. On Figure 5, this is recorded at minus 60 daPa for the right ear and minus 50 daPa for the left ear.
Peak admittance/compliance
This is the value in mmho (admittance) or ml (compliance) which is also measured at peak tympanic pressure. For normal adult middle ears, it should be between 0.3 to 1.6 mmho. On Figure 5, this is recorded at 2.38 mmho for the right ear and 2.54 mmho for the left ear. This would be considered outside the normative range.
The equivalent ear canal volume
“The equivalent ear canal volume (ECV) is an estimate of the volume of air medial to the probe, which includes the volume between the probe tip and the tympanic membrane if the tympanic membrane is intact, or the volume of the ear canal and the middle ear space if the tympanic membrane is perforated” (Fowler & Shanks, 2002, p. 180).
This estimation is obtained by measuring the admittance of the ear at 200 daPa. This is because the ear canal acts as a hard-walled cavity at this pressure and thus the middle ear does not contribute to the admittance value recorded. This is a useful way of eliminating the effect of the external ear canal on the tympanometric measurement.
On Figure 5, this is recorded at 0.79 ml for the right ear and 0.97 ml for the left ear, which are within the normal limits.
Some equipment will display this as cubic centimeters (cc or cm3). This is because 1 ml is equivalent to 1 cm3. For the rest of this article, we will use ml to describe ear canal volume. This value should be between 0.6 to 2.5 ml for adults and 0.4 to 1.0 ml for children (Katz, 2015).
Gradient
This is a measure of how sharp or flat the peak is. You can analyze either the tympanic width (TW) or the compliance (either as a ratio compared to peak pressure or the difference in peak pressure compared to the average at 50 daPa and minus 50 daPa).
You should inspect the gradient alongside the other tympanometric data. In healthy middle ears, a sharper peak, higher gradient, or smaller TW is usually seen.
A flatter presentation of the gradient is suggestive of, and sensitive to detecting, middle ear effusions (fluid in the middle ear).
On Figure 5, this is recorded at 2 daPa for both ears.
Types of tympanogram results
The correct way to interpret the tympanogram is to read the objective data and report these values as described above. An alternative way is to use Jerger’s classification, which assigns a label to a tympanogram depending on the height (compliance) and location (pressure) of the peak.
It refers to the black normative data box which shows expected normative data for adult ears (Figure 6). Despite this being a common method of reading the tympanogram, it is rather subjective and can leave itself open for interpretation bias.
Below, you can see a description of Jerger’s classification (Table 2).
| Tympanogram type | Description |
| Type A | Peak is within normal limits for both pressure and height |
| Type Ad | Peak is within normal limits for pressure but shows more compliance than normal |
| Type As | Peak is within normal limits for pressure but shows less compliance than normal |
| Type B | Flat with no significant peak |
| Type C | The peak may or may not be within normal limits for height but is clearly there and is more negative than normal |
Table 2: Tympanogram types according to Jerger’s classification.
Common pathologies and examples in tympanometry
Some middle ear pathologies have distinctive tympanometric presentations, whereas others have presentations that are similar to each other. Therefore, you must always consider tympanometry alongside a battery of assessments before you can reach a diagnosis.
Below are some common presentations and potential pathologies. To increase the diagnostic accuracy of tympanometry, clinicians should consider performing wideband tympanometry.
Pathologies affecting middle ear mass
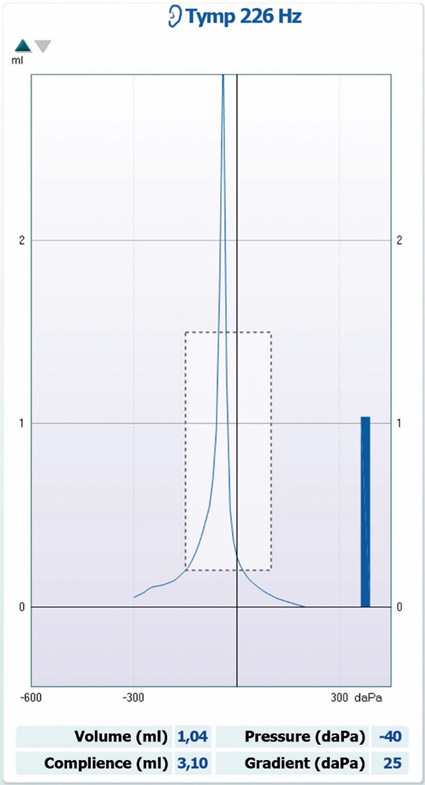
See Table 3 and Figure 7 for characteristics of tympanograms produced with pathologies that affect middle ear mass.
| Data point | Data value |
| Tympanogram type | Type Ad |
| Ear canal volume | Within normal limits |
| Peak pressure | Within normal limits |
| Peak compliance | Larger than 1.6 ml (adults) |
| Gradient | Within normal limits |
| Commonly seen in | Ossicular discontinuity or a flaccid ear drum |
Table 3: Characteristics of tympanograms produced with pathologies that affect middle ear mass.
Pathologies affecting middle ear stiffness
See Table 4 and Figure 8 for characteristics of tympanograms produced with pathologies that affect middle ear stiffness.
| Data point | Data value |
| Tympanogram type | Type As |
| Ear canal volume | Within normal limits |
| Peak pressure | Within normal limits |
| Peak compliance | Larger than 0.3 ml (adults) |
| Gradient | Dependent on pathology |
| Commonly seen in | Cholesteatoma, otosclerosis, and tympanosclerosis |
Table 4: Characteristics of tympanograms produced with pathologies that affect middle ear stiffness.
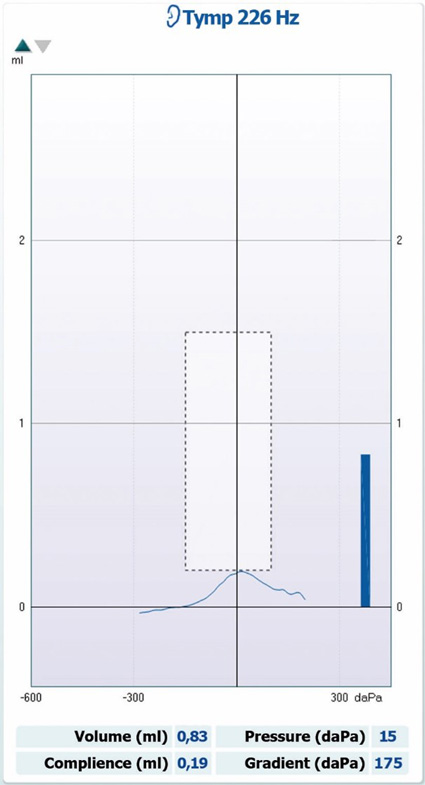
Flat tympanograms
In Table 5, you will see the descriptions for a selection of flat (type B) tympanograms. For all flat tympanograms, peak pressure and peak compliance are not recordable or severely reduced. So to distinguish between pathologies, we will focus on ear canal volume only.
| Ear canal volume | Common pathology |
| Large | Ear canal perforations |
| Within normal limits | Middle ear effusion |
| Severely reduced | Wax impaction or false fundus |
Table 5: Ear canal volumes and their corresponding pathologies for flat (type B) tympanograms.
Negative pressure tympanograms
See Table 6 and Figure 9 for characteristics of negative pressure tympanograms.
| Data point | Data value |
| Tympanogram type | Type C |
| Ear canal volume | Within normal limits |
| Peak pressure | Below normal limits |
| Peak compliance | Within normal limits |
| Gradient | Not measurable |
| Commonly seen in | Eustachian tube dysfunction or middle ear effusion |
Table 6: Characteristics of negative pressure tympanograms.
Calibration for tympanometry
To ensure accurate results in tympanometry, there are a few important checks and calibrations that – depending on the specific check or calibration – you or a trained technician should perform at given intervals.
Daily checks
A tympanometer should be checked on a daily basis, using a hard-walled cavity. These are normally provided with the system or integrated into the tympanometer in some way. A hard-walled cavity is a small chamber of a fixed, known volume (usually 2 cc, 0.5 cc or 4 cc), with an adapter that allows the tympanometer probe to be inserted securely with a perfect seal.
A standard tympanometry measurement should be taken in the hard-walled cavity and the results should read the correct volume of the cavity within a tolerance which is normally printed on the cavity itself. The results should also show no change in compliance.
If the results fall outside of this tolerance, then the tympanometer should be checked for any obvious damage or fault. The tympanometer should also be checked with a known normal ear to show that correct compliance is being measured.
Annual checks
A tympanometer should also be calibrated on an annual basis using sound level meters, manometers, and the appropriate couplers. This process is essential in ensuring the tympanometer continues to function appropriately.
Probe tone calibration
All probe tones should be calibrated separately to ensure they are presenting the stimulus at the desired level. This is essential as the presented tone must be at the specified level for the measurement of residual tone in the ear canal to be accurate.
A 2-cc coupler is used to simulate the ear canal, and appropriate adapters are used to make sure the probe and ear tip form a seal. The output level is adjusted so that the desired output is measured by the microphone in the 2-cc coupler.
Compliance (volume) calibration
The microphone components of the tympanometry probe must also be calibrated to ensure they are recording the correct volume of sound in the ear canal. This is also done in a hard-walled 2-cc cavity. Probe tone calibration must be completed before compliance calibration.
Pressure sensor calibration
A manometer is connected to the tympanometer and a syringe. The required pressure can be applied to the probe with the syringe. There are various pressures that should be calibrated for any given tympanometer.
References
Fowler, C. G., & Shanks, J. E. (2002). Tympanometry. In J. Katz (Ed.), Handbook of clinical audiology (5th ed., pp. 175-204). Lippincott Williams & Wilkins.
Hunter, L. L., & Shahnaz, N. (2013). Acoustic Immittance Measures: Basic and Advanced Practice. Plural Publishing.
Jerger J. (1970). Clinical experience with impedance audiometry. Archives of otolaryngology (Chicago, Ill. : 1960), 92(4), 311–324.
Katz, J. (2015). Handbook of Clinical Audiology. Wolters Kluwer.
Koebsell, K. A., & Margolis, R. H. (1986). Tympanometric gradient measured from normal preschool children. Audiology : official organ of the International Society of Audiology, 25(3), 149–157.
TERKILDSEIN, K., & THOMSEN, K. A. (1959). The influence of pressure variations on the impedance of the human ear drum. A method for objective determination of the middle-ear pressure. The Journal of laryngology and otology, 73, 409–418.
Presenter
