Subscribe to the Interacoustics Academy newsletter for updates and priority access to online events
SVV: Angle of Deviation vs SVV Estimate
Description
That is a good question as you could argue that either approach for displaying the results is acceptable.
Of course both values are provided/calculated, so your question perhaps relates to why the graphical display is plotted with angle of deviation [Δ] not SVV [β].
One consideration is that Δ and not β is used for reasons of ease of interpretation in the various different static head tilt conditions.
That is, if you showed either Δ or β for the upright head condition it would be inconsequential as both Δ and β would give the same value, but in the various head tilt conditions that the cSVV instrument enables you to measure, these two measures will give different values (since β is displayed relative to head tilt angle, α).
So, take a “normal and healthy” result – you should always end up with a Δ of 0° irrespective of head tilt which, when plotted, produces a horizontal line intercepting the y-axis of the graph.
However, if β were plotted on the y-axis then a “normal & healthy” result would not give a horizontal line as the β result would not always be 0°. Instead the data would produce a line at 45° (since β is displayed relative to α), and perhaps this (or deviations from this normal pattern) is a little harder to read (when “eyeballing” the data).
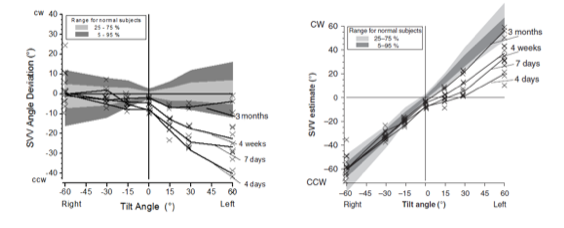
As it happens, β rather than Δ results are displayed by Schönfeld and Clarke (2011) and this enables a simple illustration. For example see the below figure from this reference, which shows the SVV findings in the case study of a 59 year old female in the acute and chronic phase of a left unilateral vestibular loss. The left panel in the figure shows the results with Δ plotted on the y-axis (similarly to how it would appear in the cSVV instrument) and the right panel shows the same findings but now with β plotted on the y-axis (although please note different scales used in these two plots).

Plots of SVV data showing SVV angle of deviation (left panel) and SVV angle (right panel), both with ranges for normal subjects and data from a case with a left unilateral vestibular deficit.
References
Schönfeld U., Clarke A. H. – 2011: A Clinical Study of the Subjective Visual Vertical during Unilateral Centrifugation and Static Tilt; ActaOtolaryngol 131(10):1040-50
Presenter

Get priority access to training
Sign up to the Interacoustics Academy newsletter to be the first to hear about our latest updates and get priority access to our online events.
By signing up, I accept to receive newsletter e-mails from Interacoustics. I can withdraw my consent at any time by using the ‘unsubscribe’-function included in each e-mail.
Click here and read our privacy notice, if you want to know more about how we treat and protect your personal data.
